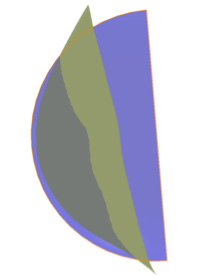
External Surface OCT Scan
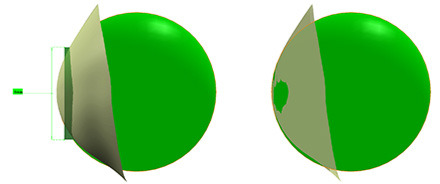
The Laserfit™ Lens process begins by digitally scanning the anterior surface of the eye using optical coherence tomography. The result is a series of greyscale images like the one shown below. It looks very much like a CT-scan, but is done with a low powered low coherence diode laser. When assembled using state-of-the-art software, a digital 3D model is obtained (yellow image), which can be manipulated and measured.
From the profile image, it’s easy to see how the curvature changes from flat at the top to steep at the bottom. One can also appreciate the variable thickness of the cornea: thicker on top and thin at the bottom. This is the classic shape of advanced keratoconus, where the cornea has become weak and developed a bulge. Gravity and eyelid forces cause the cornea to sag.
Shape Analysis & Reference Sphere Comparison
The next step in analyzing the shape is to calculate a reference shape such as a sphere. We can generate the reference sphere from a designated set of points, and then finding the best fitting sphere that goes through those points. In this case we have selected the centermost 6 mm area of the cornea to create our reference sphere.
By carefully examining the profiles of the reference sphere against the keratoconus cornea, one can appreciate areas where the cornea is flatter than the reference sphere and areas where it is steeper than the reference sphere. These deviations are what contribute the most to the image distortions caused by keratoconus.
Altering the Lens Thickness for Phase Conjugation
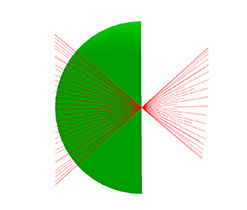
The next step is to examine the optical properties of a perfect sphere. In this case we are only analyzing shapes. The image below shows a simple ray tracing example of how parallel incident light will converge to the center of the sphere, which is the radius of the sphere. Since all of the light rays arrive together at a point, we say that the rays have phase conjugation.
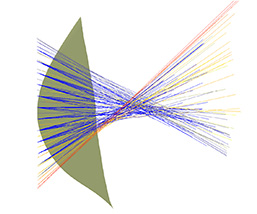
The same analysis using the keratoconus cornea instead of its reference sphere yields a much different result. The light rays do not come to a sharp point focus, but are spread out. The wavefront is not in phase.
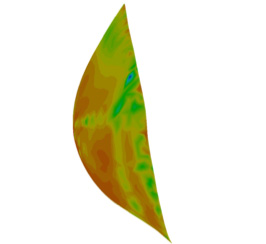
The keratoconus cornea is much more complex than a simple sphere, and causes the light rays to go off in different directions according to the complex curvature changes. The image to the below is a topography map from OCT data.
The actual situation is much more complicated because of the changes in corneal thickness and index of refraction as the light passes from the air through the tear film, the first surface of the cornea, the second surface of the cornea, the anterior chamber, the first surface of the crystalline lens and the second surface of the crystalline lens before it gets to its destination at the retina. Even a contact lens cannot correct all of these phase differences.
The image below shows the reference sphere converted to a simplified contact lens. A tear layer exists between the lens and the cornea. It’s obvious that the tear layer is uneven in thickness, and that the tear layer is thicker towards the bottom of the lens where the cornea is steeper. This creates a minus or negative tear miniscus with a negative power, while the upper tear layer creates a plus power. These and more optical path differences can be measured with an aberrometer.
By altering the thickness of the contact lens to correct the optical path differences using mathematical formulae, wavefront-guided LaserfitTM Lenses can make the wavefront of light more coherent.
The result is that more light reaches the intended target achieving clearer vision with fewer artefacts such as glare, halos, and ghost images.
Download the pdf version of this article: Wavefront Lens Process Simplified


